Site speed monitoring made simple
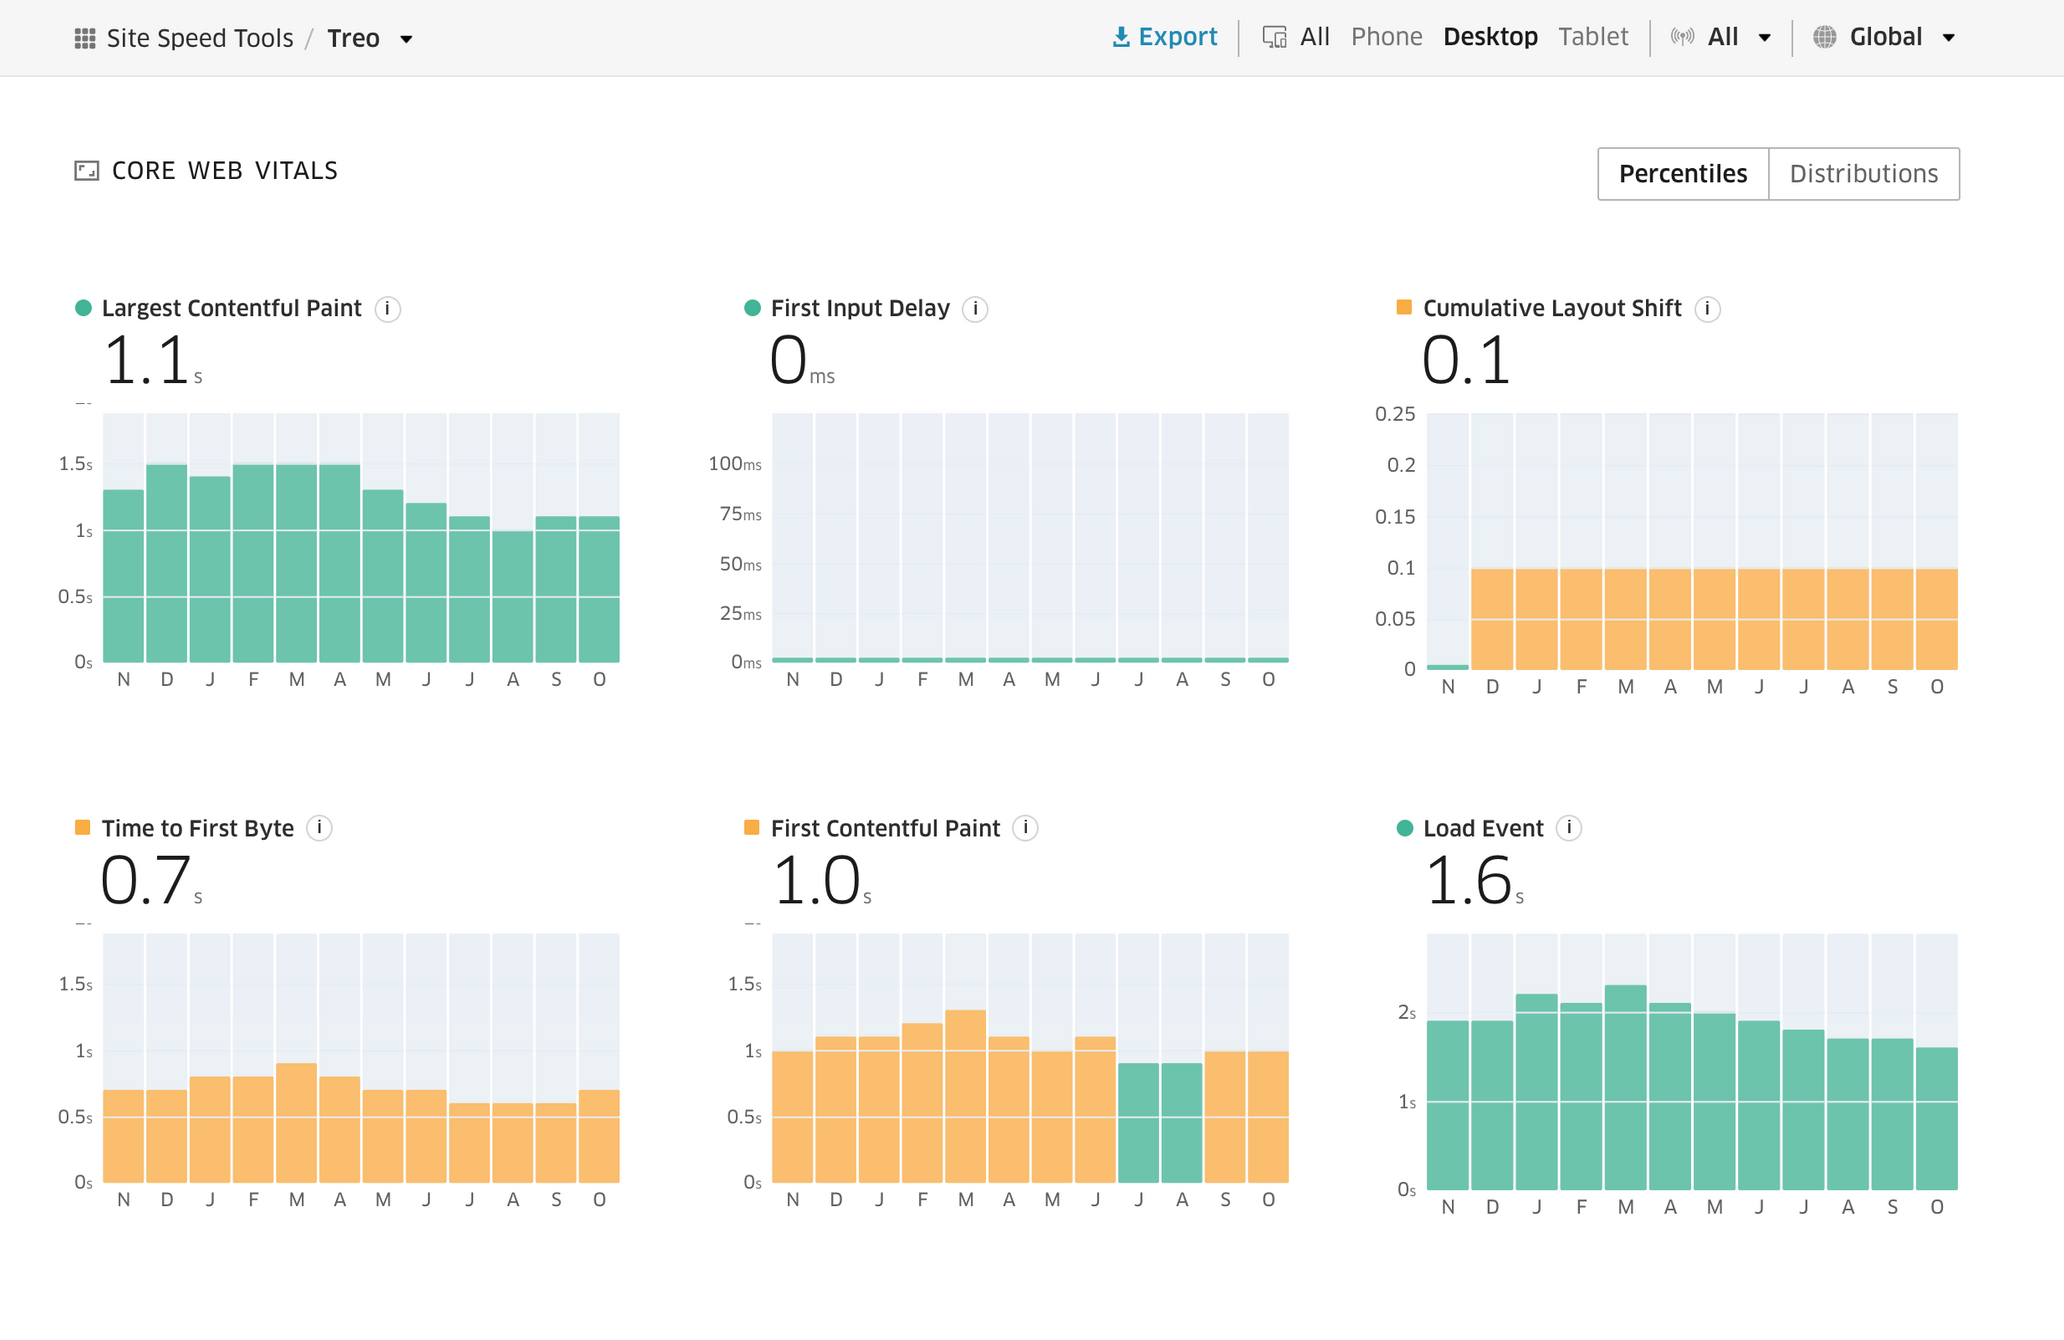
- ✓Core Web Vitals without setup and tracking;
- ✓Competitive analysis based on real-users data;
- ✓Chrome UX Report dashboard with historical data across devices, connections, and locations.


Chrome UX Report data in all its richness.

Explore all the data from the CrUX dataset – form factors, connection types, metric distributions, and country details. Treo operates with raw CrUX data and shows it in a powerful dashboard. If you do it yourself, it costs $80 to scan 16 terabytes for one domain using BigQuery and thousands more to support a dashboard.

Improve search ranking using Core Web Vitals and Lighthouse.

Core Web Vitals are search signals for page experience. Explore real-user data for your web pages and improve them using Lighthouse recommendations.

Benchmark your website with your competitors.
Instantly make a comprehensive competitive analysis and convince your management to invest in user experience. Core Web Vitals are ideal KPIs to track monthly using Chrome UX Report as a reliable data source.

Raw CrUX data. Zero SQL.
Query 165 TB of Chrome User Experience data instantly. Treo transforms 5 years of raw BigQuery tables into clear visual metrics, bypassing the cost and complexity of building custom data pipelines.
History
5 years of historical data
Access to 5 years of historical CrUX data, with new data added monthly. Analyze long-term trends and gain insights into your competitors' performance.
Massive Scale
Unmatched Archive
Direct BigQuery scans cost $6 per TB. We manage the ingestion and storage of 15,000+ tables (165 TB) so you get instant access to all metrics across any website.
Global Scope
Worldwide Coverage
Access the map with data from 200+ countries and territories. Explore your metrics, RTT, and see local performance trends.
Custom metrics
Percentiles & Distribution
You're not limited to p75 and default intervals. Since Treo gives you access to real distributions, you can configure your own percentiles and intervals.
Powerful features for development and marketing teams.
Treo makes it easy to access historical real-users data and improve the speed of your website. Improve your web pages with Lighthouse and see your success as experienced by actual users.
Powered by Chrome UX Report
CrUX is a dataset collected from real-world users, that used for page speed ranking.
Core Web Vitals
Focus on Core Web Vitals and build delightful web experience.
Export
Download your data and analyze it using your custom tools.
Domain-level
Enter your domain and get historical data across devices, connections, and locations.
Page-level
Use Lighthouse to monitor important pages and get an aggregated RUM-data for popular URLs.
API
Access the raw data using a simple JSON API.
Feedback from industry experts:


Try Treo with a 14-day free trial
Get started →Made in the EU. All rights reserved. Copyright © 2017 – 2026 Treo d.o.o. VAT: SI34122079.